COVID-19 Risk Perspective
CDC estimates 10.4-16.7 million COVID-19 illnesses and 34,000-53,000 deaths in the US during the 2024-25 respiratory virus season — figures now tracked as modeled ranges rather than confirmed case counts, since COVID-19 is no longer individually notifiable nationwide.
Written and researched by Andy Wilcox · Last reviewed: August 2026
The Numbers
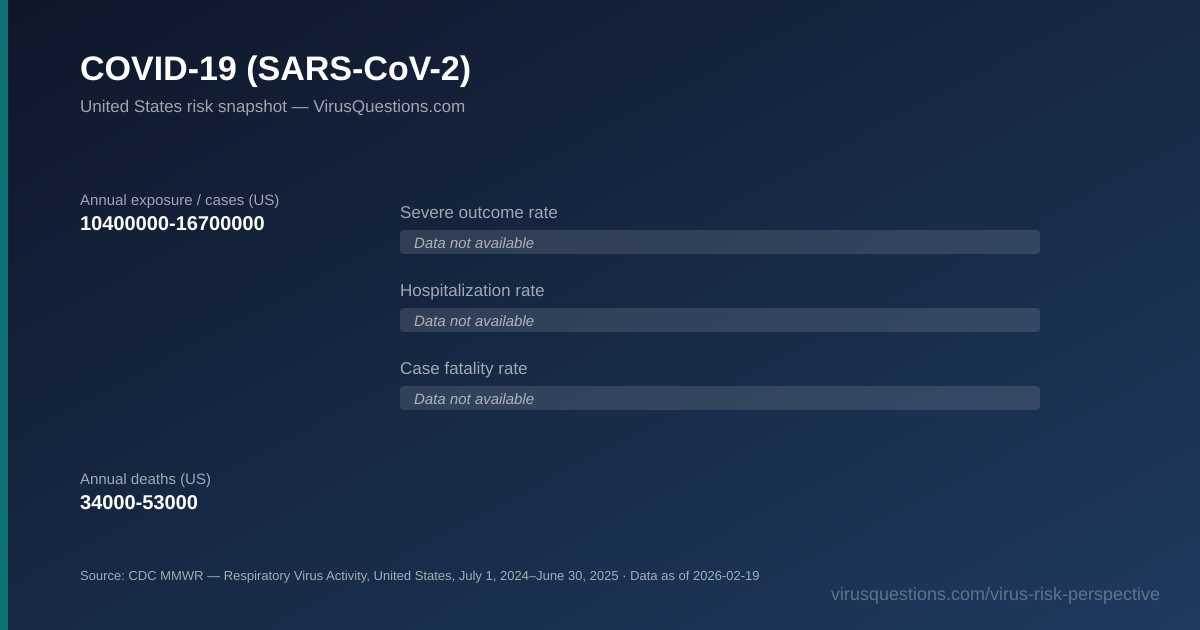
Every published figure, and where it came from
These are the figures COVID-19 is actually reported with, each shown beside the source that published it and the date it was current. They are read from a single dataset shared across this network, so a correction made once reaches every page that cites it.
| Metric | Figure | Source | As of |
|---|---|---|---|
| Annual exposure / cases | 10,400,000–16,700,000 | CDC MMWR — Respiratory Virus Activity, United States, July 1, 2024–June 30, 2025 primary source | 2026-02-19 |
| Severe outcome rate | Data not available | CDC MMWR — Respiratory Virus Activity, United States, July 1, 2024–June 30, 2025 primary source | 2026-02-19 |
| Hospitalization rate | Data not available | CDC MMWR — Respiratory Virus Activity, United States, July 1, 2024–June 30, 2025 primary source | 2026-02-19 |
| Case fatality rate | 0.2–0.51% | CDC MMWR — Respiratory Virus Activity, United States, July 1, 2024–June 30, 2025 primary source | 2026-02-19 |
| Annual deaths | 34,000–53,000 | CDC MMWR — Respiratory Virus Activity, United States, July 1, 2024–June 30, 2025 primary source | 2026-02-19 |
Illness/hospitalization/death figures are Oct 1, 2024–Jul 5, 2025 modeled range estimates; COVID-19 is no longer nationally notifiable, so no clean confirmed-case count exists. cases_per_100k is left UNAVAILABLE. case_fatality_rate_pct is now shown as a BOUNDING RANGE (0.2-0.5%) rather than a point: the low bound is the smallest deaths / largest illnesses and the high bound the reverse, so it honestly spans the uncertainty in the two published ranges instead of inventing a single pairing. The 'How a figure changes over time' trend for COVID shows two honestly-separate NCHS death-certificate series (they must not be merged): deaths involving COVID-19 (underlying or contributing) — 377,883 (2020), 460,513 (2021), 244,986 (2022), 76,446 (2023) — and the narrower underlying-cause-only count — 345,323 (2020), 415,399 (2021), 186,702 (2022), 49,928 (2023). Both use a different method than the current-season modeled figure shown as the live value, so they are not directly comparable to it.
What is not measured, and why that matters
2 of these five metrics have no published figure for COVID-19: severe outcome rate, hospitalization rate. Rather than estimate them, borrow a number from a different population, or present one study's result as a general rate, they are left empty.
This is worth understanding before comparing COVID-19 to anything else: an empty figure is not a low one. It means nobody has published the measurement. Read as zero, it would make the least-studied diseases look like the safest.
How these figures have moved
Each row is the figure as it stood on that date, with the source that published it. Nothing is interpolated between points — where an agency published a figure once, one point is shown rather than a line drawn through invented values.
Annual deaths
| As of | Figure | Series | Source |
|---|---|---|---|
| 2020-12-31 | 377,883 | Involving COVID-19 (underlying or contributing) | CDC MMWR — Provisional Mortality Data, United States, 2020 |
| 2020-12-31 | 345,323 | COVID-19 underlying cause only | CDC MMWR — Provisional Mortality Data, United States, 2020 |
| 2021-12-31 | 460,513 | Involving COVID-19 (underlying or contributing) | CDC MMWR — Provisional Mortality Data, United States, 2021 |
| 2021-12-31 | 415,399 | COVID-19 underlying cause only | CDC MMWR — Provisional Mortality Data, United States, 2021 |
| 2022-12-31 | 244,986 | Involving COVID-19 (underlying or contributing) | CDC MMWR — Provisional Mortality Data, United States, 2022 |
| 2022-12-31 | 186,702 | COVID-19 underlying cause only | CDC MMWR — Provisional Mortality Data, United States, 2022 |
| 2023-12-31 | 76,446 | Involving COVID-19 (underlying or contributing) | CDC MMWR — Mortality in the United States, Provisional Data, 2023 |
| 2023-12-31 | 49,928 | COVID-19 underlying cause only | CDC MMWR — Mortality in the United States, Provisional Data, 2023 |
Beyond the United States
WHO's dashboard counts 7,116,554 deaths and 779,366,737 cases reported to WHO cumulatively through 30 August 2026. Those are cumulative totals, and the annual slices are not comparable to the US single-season figures: only 26,889 deaths were reported to WHO for calendar year 2025, from 46 of 240 reporting countries and areas, because global COVID-19 surveillance has wound down — the annual global cells are therefore left UNAVAILABLE rather than charted as a misleading side-by-side. For scale, WHO estimates about 14.9 million excess deaths were associated with the pandemic worldwide in 2020–2021 (range 13.3–16.6 million; WHO news release, 5 May 2022), far more than the deaths officially reported over that period.
Compare COVID-19 against 14 other viruses →
How these sources are tiered, and why a calculated figure is never rated above its weakest input →
Severe outcome rate, hospitalization rate, and case-fatality rate figures specific to COVID-19 are not published by CDC as a single national percentage, so this page reports the illness and death range only. See the full comparison tool for how this fits alongside 14 other viruses.
Case counts and mortality data on this page are sourced directly from CDC as cited above. This is statistical and educational information, not medical advice or a risk assessment for any individual. Figures change as CDC updates seasonal estimates — check the "data as of" date and linked source for the latest numbers.
Compare COVID-19 against 14 other viruses on the Virus Risk Perspective tool →